Experiment: Graph View
I’ve been stewing on a better way to present a website and for organizing my personal thoughts. This post includes a brief demo of me experimenting in this realm.

Background
Obsidian
I’ve been observing Obsidian.md for the last little while. One of the neat features Obsidian supports is the Graph View. It essentially allows you to see how different pages link to each other and follow those links.
engram
I’ve now been building engram for about a year now. One of the primary objectives has been to give a place for raw, unfiltered, and unstructured thoughts. In many ways I have found this to be successful in providing a much quicker place to get my ideas down. Now that I have a year’s worth of information, I’m itching to be able to reflect on historical notes.
From the start I knew that I wanted some way to organize information - but I also knew that I wanted to do this without the usual boring interface. I prototyped a game a while back that consisted of floating thought bubbles. This was mostly to try and get some ideas flowing.
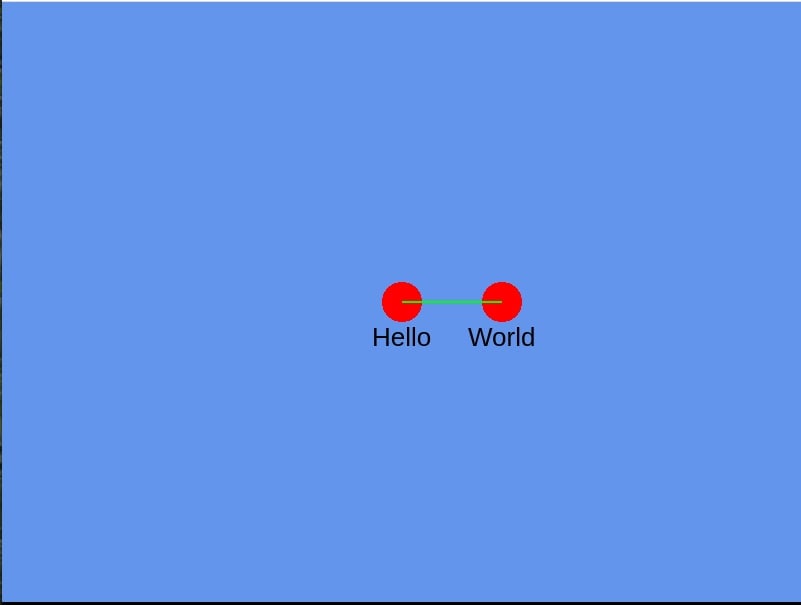
I recently stumbled across the graph view again when someone brought it up in conversation. About ten minutes later I had a tiny pixi.js app that rendered a Hello World graph.

I’m now starting to see that this could possibly be a useful interface for organizing thoughts. By default the quick notes entered in engram are not linked to anything. Each note becomes a node or “star” in an infintely expanding 2D canvas. The unlinked notes are randomly placed some distance away from the center where one begins to structure everything. Then when time and energy permits you can open the graph and go explore the “stars” in the outer perimeter. The randomness ensures that you stumble across different kinds of notes potentially finding associations amongst seemingly unrelated items. Nodes can then be multi selected and linked to anything else and re-positioned.
“Why bother with this?”, you might ask. It’s been proven that our brains are much better at remembering things spatially. In a typical hierarchical folder structure (like on a computer, VS Code, Notion, etc.), I am often unable to find what I am looking for. But 2D representation of everything allows me to create constellations of thought. Locating and organizing things (hopefully) becomes more fun this way. And when something is fun, we keep coming back to it.
Graph View 0.0.1
Tech
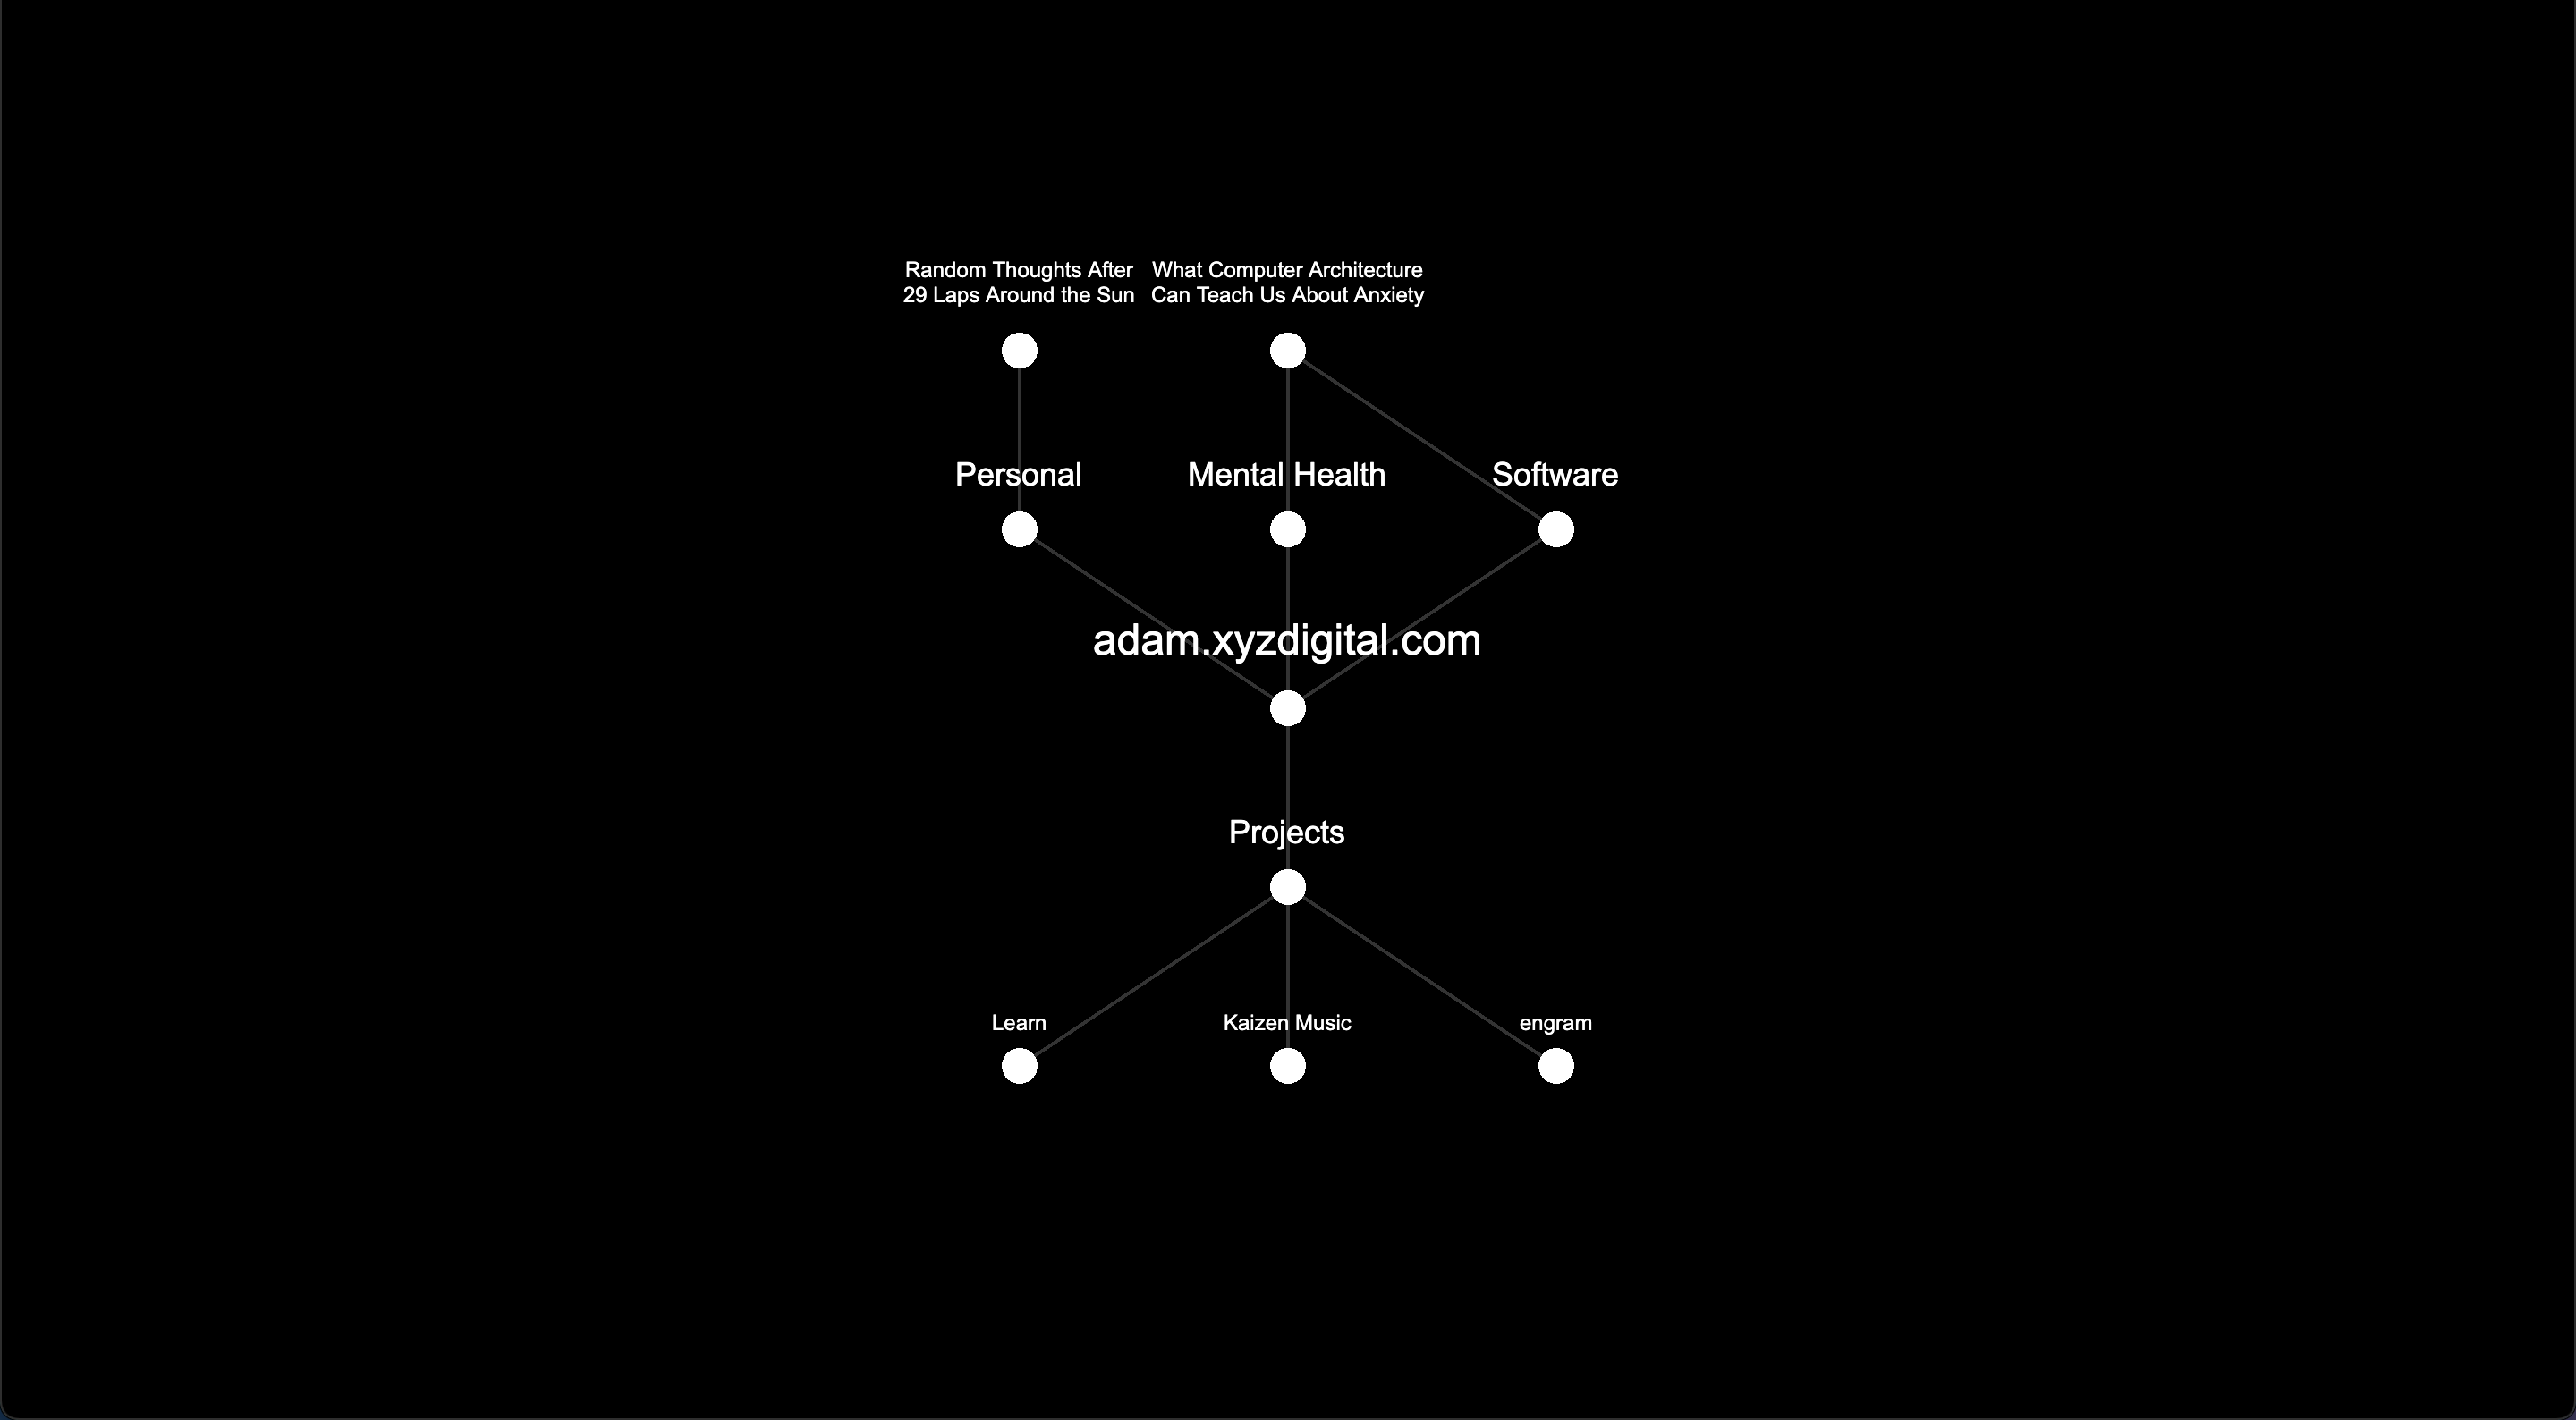
The above came together so quickly I decided it was worth putting together something a bit more substantial. The code can be found here. The rendering is done on an HTML canvas with pixi.js. I was tempted to write my own code to manage scrolling around the page, but decided to save that for later and went with pixi-viewport. pixi-viewport worked immediately out of the box, which is often not the case for things like this.
I have also switched over to using esbuild exclusively in my personal projects. I deal with stupidly long builds with webpack in numerous projects constantly wondering how long it really takes to concatenate a couple MB of data. esbuild pumps out a fresh production build in milliseconds even on my aging laptop. Even a simple create-react-app can take something closer to 10 seconds for a production build.
Demo
You can click and drag or scroll to move around the “world”. On desktop, clicking on certain nodes will open up the corresponding link in a new tab.